
いまさらビーコン? されどビーコン!
2024/04/09

はじめまして、アプリケーションエンジニアの岡崎です。
今回はJavaScriptでグラフを描画するライブラリ「Chart.js」に関する記事です。
IoTデバイスから取得したデータをグラフ描画するために
弊社ではJavaScriptライブラリの「Chart.js」を使用しています。
Chart.jsなら手軽にグラフの実装ができて、視認性の良いグラフを簡単に作ることができます。
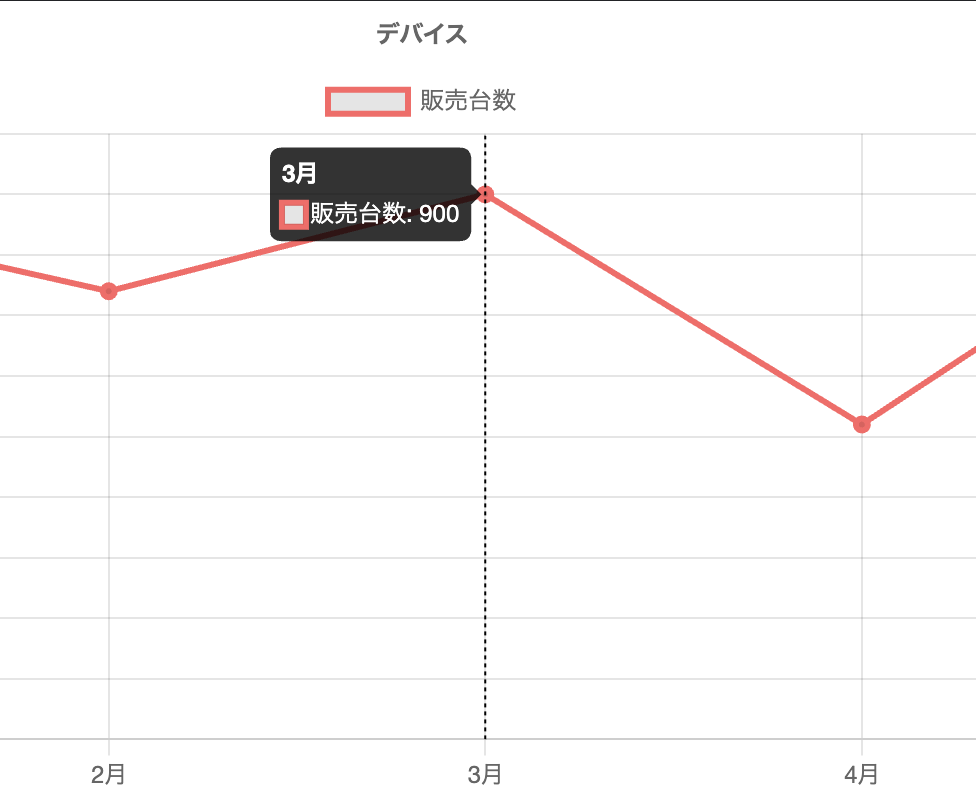
下記画像のようなマウス移動した任意のポイントに
縦線表示するChart.jsのプラグインを作ってみました。
GitHubのリンクはこちらです。
サンプルグラフ
※マウス移動すると縦線が表示されます。
Chart.jsはバージョンによって記法が違い、
2系のバーションで動いていたコードが3系以降では動かなくなる場合があります。
Chart.jsに関する様々な記事が出回っていますが、
使いたいコードがあってもコピペでは思った通りには動いてくれません。
そのため、2系用、3系以降用(現最新バージョン4.2.1)で動作するプラグインを
それぞれ作成しました。
本当はどちらでも動く共通のプラグインを作りたかったのですが。。。
今現在の縦線位置がマウス座標ではなく、
ツールチップのX座標に沿う形にしています。
Chart.plugins.register({
    id:'verticalLinePlugin',
    beforeEvent: function(chart, e) {
        const elms = Chart.Interaction.modes.nearest(chart, e, chart.tooltip._options);
        if ((elms.length > 0) &&
            (e.x >= e.chart.chartArea.left) && (e.x <= e.chart.chartArea.right) &&
            (e.y >= e.chart.chartArea.top) && (e.y <= e.chart.chartArea.bottom)) {
            chart.options.verticalLinePlugin.x = elms[0]._model.x;
        } else {
            chart.options.verticalLinePlugin.x = NaN;
        }
    },
    afterDraw: function(chart) {
        var ctx = chart.chart.ctx;
        var chartArea = chart.chartArea;
        var x = chart.options.verticalLinePlugin.x;
        if (!isNaN(x)) {
            ctx.save();
            //ラインの太さ
            ctx.lineWidth = chart.options.verticalLinePlugin.lineWidth;
            //ラインの色
            ctx.strokeStyle = chart.options.verticalLinePlugin.color;
            //点線の場合:[線の長さ, 間隔の長さ]、実線の場合:[]
            ctx.setLineDash(chart.options.verticalLinePlugin.setLineDash);
            ctx.beginPath();
            ctx.moveTo(chart.options.verticalLinePlugin.x, chartArea.bottom);
            ctx.lineTo(chart.options.verticalLinePlugin.x, chartArea.top);
            ctx.stroke();
            ctx.restore();
        }
    }
});
Chart.register({
    id:'verticalLinePlugin',
    beforeEvent: function (chart, args) {
        const e = args.event;
        const elms = chart.getElementsAtEventForMode(e, 'nearest', { intersect: false }, true);
        if ((elms.length > 0) &&
            (e.x >= e.chart.chartArea.left) && (e.x <= e.chart.chartArea.right) &&
            (e.y >= e.chart.chartArea.top) && (e.y <= e.chart.chartArea.bottom)) {
                chart.options.verticalLinePlugin.x = elms[0].element.x
        } else {
            chart.options.verticalLinePlugin.x = NaN;
        }
    },
    afterDraw : function(chart) {
        var chartArea = chart.chartArea;
        var x = chart.options.verticalLinePlugin.x;
        if (!isNaN(x)) {
            ctx.save();
            //ラインの太さ
            ctx.lineWidth = chart.options.verticalLinePlugin.lineWidth;
            //ラインの色
            ctx.strokeStyle = chart.options.verticalLinePlugin.color;
            //点線の場合:[線の長さ, 間隔の長さ]、実線の場合:[]
            ctx.setLineDash(chart.options.verticalLinePlugin.setLineDash);
            ctx.beginPath();
            ctx.moveTo(chart.options.verticalLinePlugin.x, chartArea.bottom);
            ctx.lineTo(chart.options.verticalLinePlugin.x, chartArea.top);
            ctx.stroke();
            ctx.restore();
        }
    }
});
optionsに下記コードを追加します。
線の色、線の太さ、点線表示を変更できるようにしています。
2系、3系以降でoptionsの記法が違っていますので注意が必要です。
var options = {
    plugins: {
        tooltip: {
            enabled: true,
            mode: 'nearest',
            intersect: false
        },
        verticalLinePlugin: true
    },
    verticalLinePlugin: {
        color : 'black',
        lineWidth : '1',
        setLineDash : [2,2]
    }
};
var options = {
    tooltips: {
        enabled: true,
        mode: 'nearest',
        intersect: false
    },
    plugins: {
        verticalLinePlugin: true
    },
    verticalLinePlugin: {
        color : 'black',
        lineWidth : '1',
        setLineDash : [2,2]
    }
};
Chart.jsにはまだまだ色々なオプションやプラグインが用意されているので、
また別の機会に紹介したいと思います。
PREV
会社環境において『物理的距離』は大切❗NEXT
調達した資金は、どういうお金?